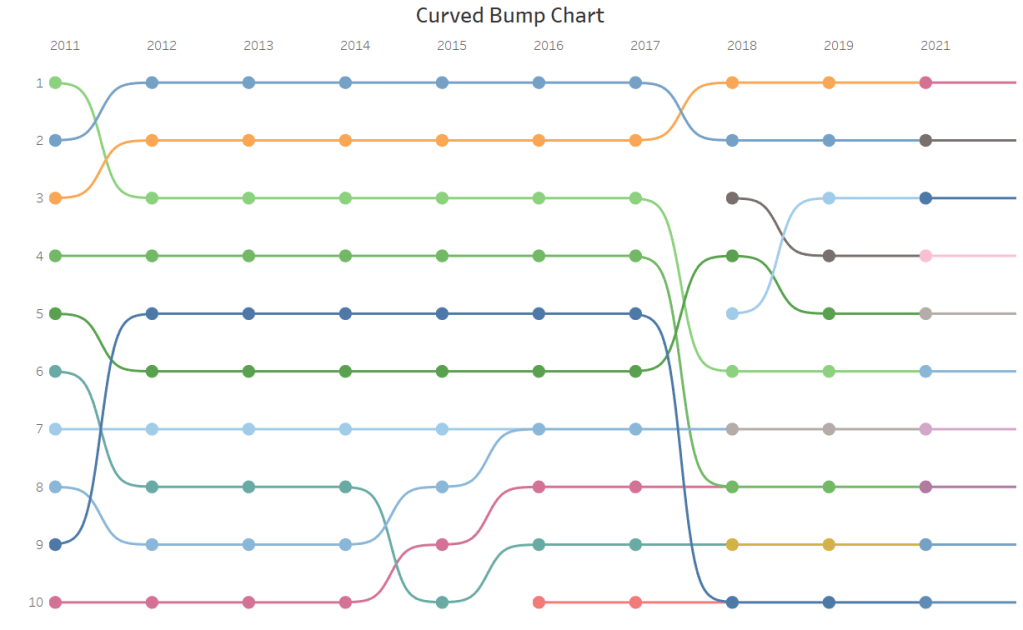
A bump chart is useful to see how value of a particular dimension changes with respect to other dimension over time. It more effective when the value being tracked or compared is Rank.
A bump chart is usually like a line chart, but when there are too many crossing its not so appealing. Hence the interest in curved Bump Chart. I have created the bump chart based on the works of Rody Zachovich.(Difference is I used data densification method. )Check his blog here.
Lets Begin:
Download the data. Please note that this is made up data for illustration.
Import the data to Tableau public. Union the data with itself. –This is to create two distinct values for Path and create data densification. I referred to article by Toan Hoang for this.
- Create a calculated field Path
IF [Table Name]=’Sheet1′
THEN 1
ELSE 49
END
- Create Path (bin) with step size of 1 . –This will give us 49 points so that we can draw our curve along those points
- Create calculated field [Index]
index()
- Create calculated field T and Sigmoid
[T]
([Index]-25)/4 –Index is calculated along Path (bin).Hence value of T will be from -6 to 6
[Sigmoid]
1/(1+EXP(-[T]))
Lets plot and see our progress
- Drag [Path (bin)] to rows. Check the show missing value option. Drag [Path (bin )] to Detail.
- Drag [T] to columns and [Sigmoid] to rows. Right click and set compute using to Path (bin) for [T] and [Path (bin)].
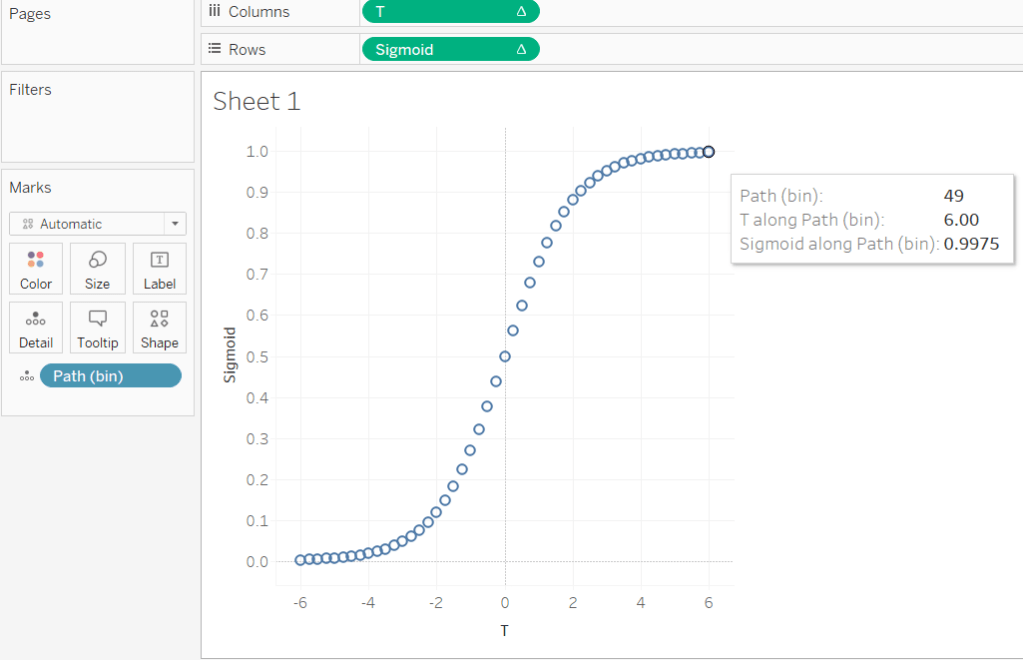
We have 49 points plotted against [T].
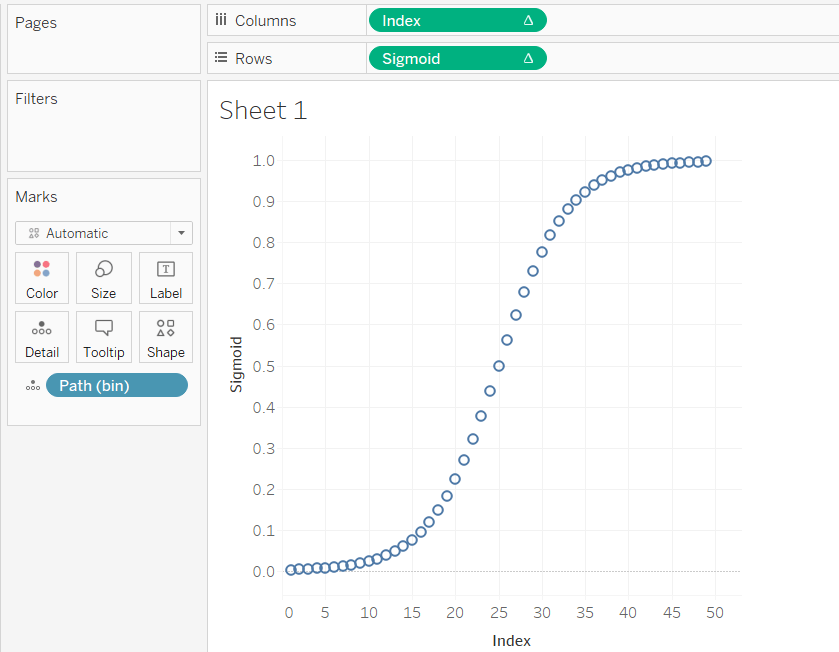
- Replace [T] with [Index].
Drag [Year] to column and make it discreet.
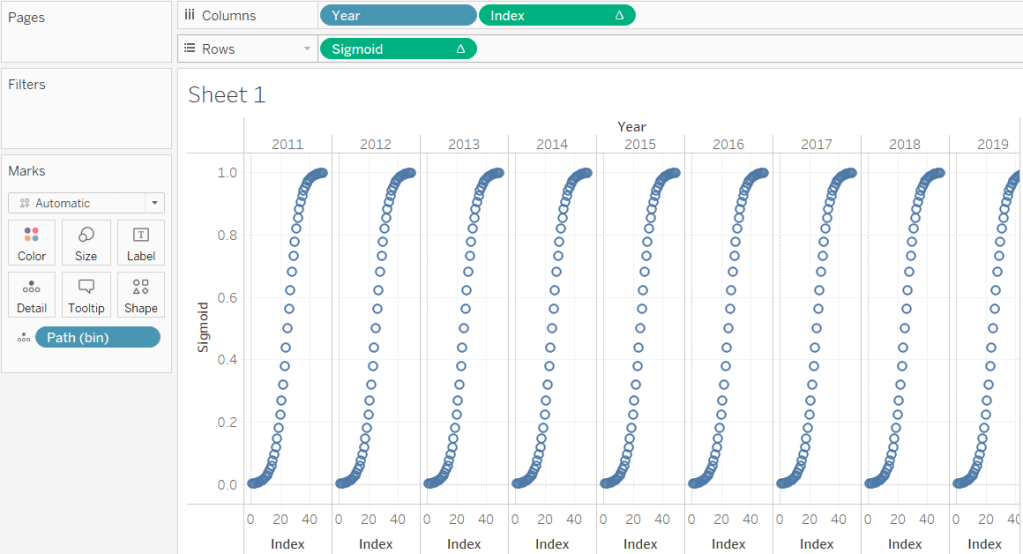
For each [Year], we have [Index] and a sigmoid curve. Great..
- Change the Marks from Automatic to Line.
Add the Rank for each [city]to the sigmoid curve.
- Create calculated field [Rank1]
WINDOW_MAX(MAX([Rank]))
- Create calculated field [Curve]
[Rank1]+[Sigmoid]
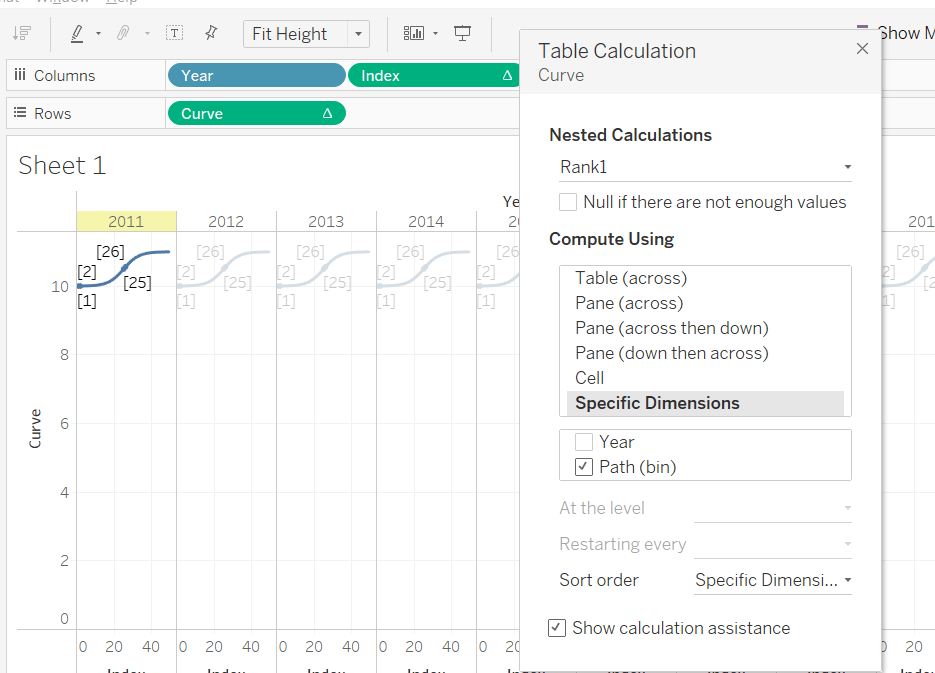
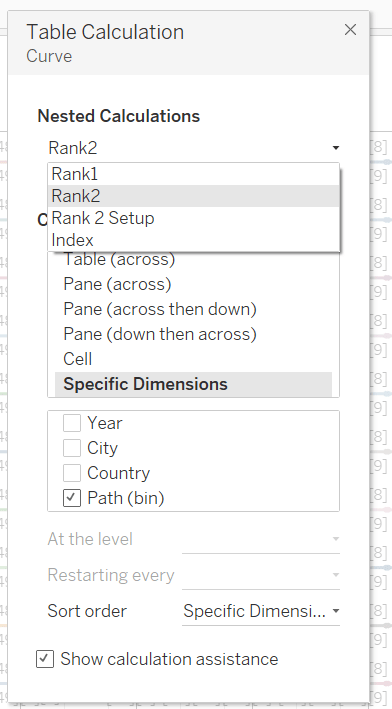
- Replace[Sigmoid] in Rows with [Curve].In Nested calculation, make sure that compute using is set to Path (bin).
Drag [City] to detail.
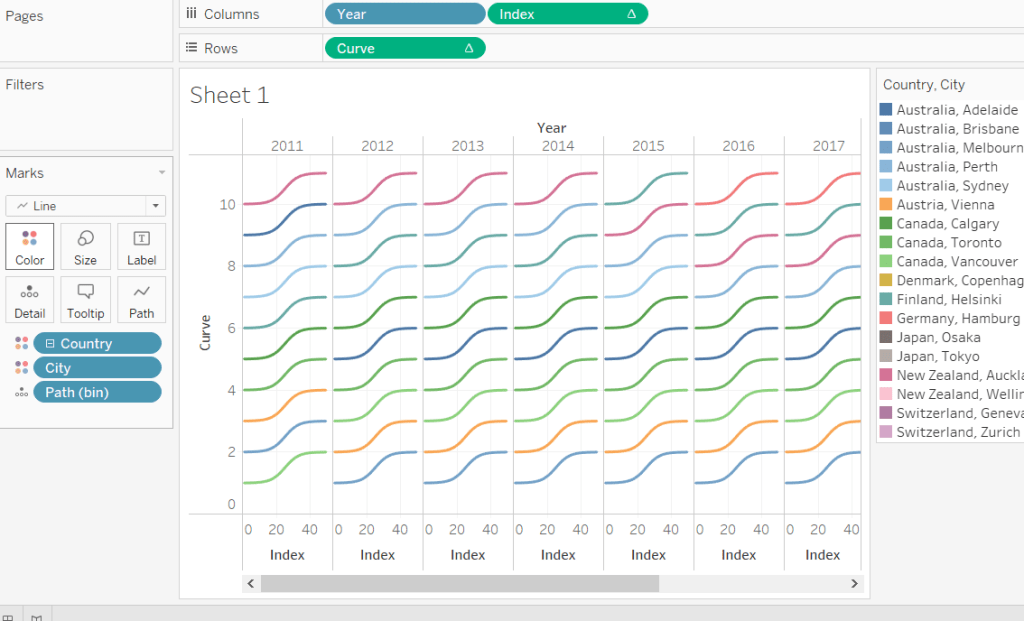
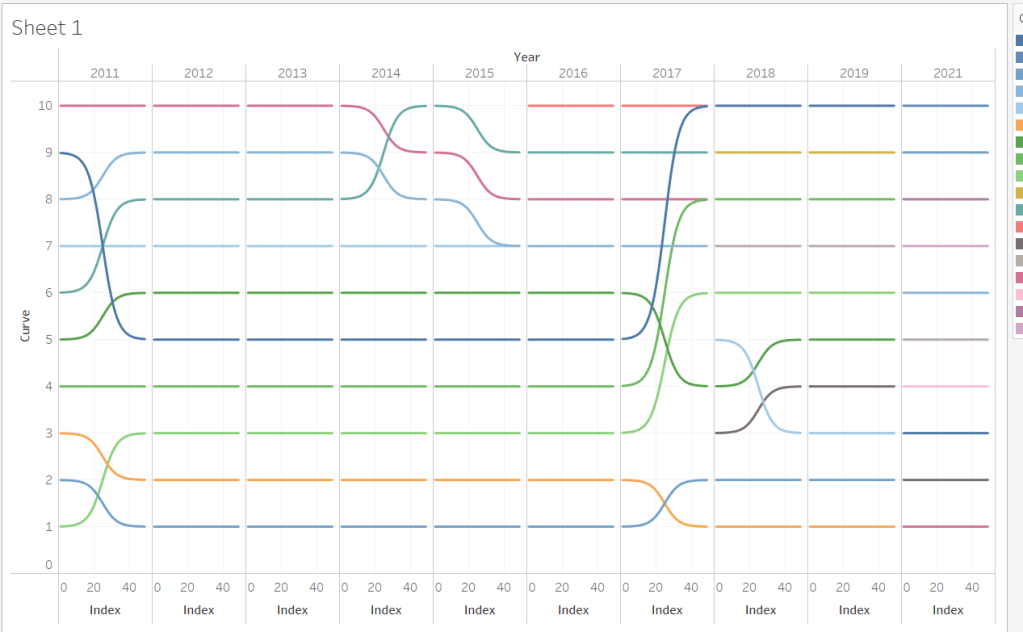
We have the Rank for each City in a Year. Now all the curve are just going upward. We need the curve to end where the next Rank for the City starts.
So for a City we need to get the Rank in the consecutive Year.
- Create [Rank 2 Setup]
IF ([Index] = 49 and LOOKUP(min([Year]),1)=min([Year])+1)
THEN LOOKUP([Rank1],1)
END
–if index is 49 and the next [Year] in the row is the consecutive Year, We lookup the next Rank.
Lets check the Tabular data to see what is happening here. For [Rank 2 Setup] set compute using to [Year],[Path (bin)].
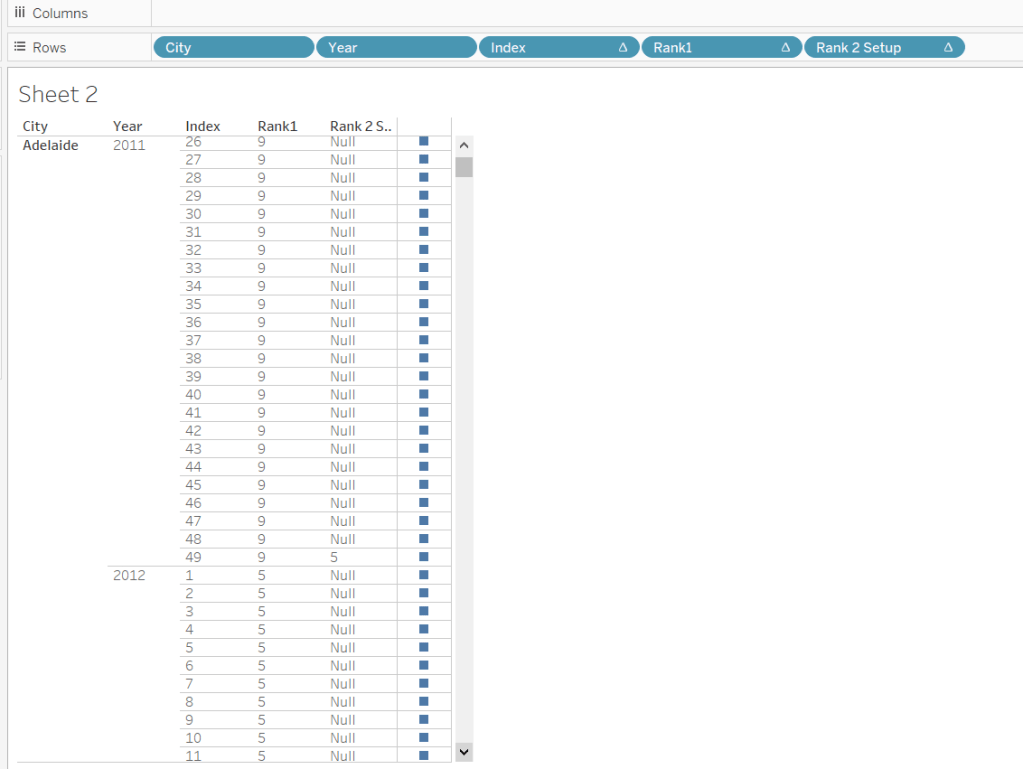
When Index is 49, [Rank 2 Setup] has the value of next Rank.
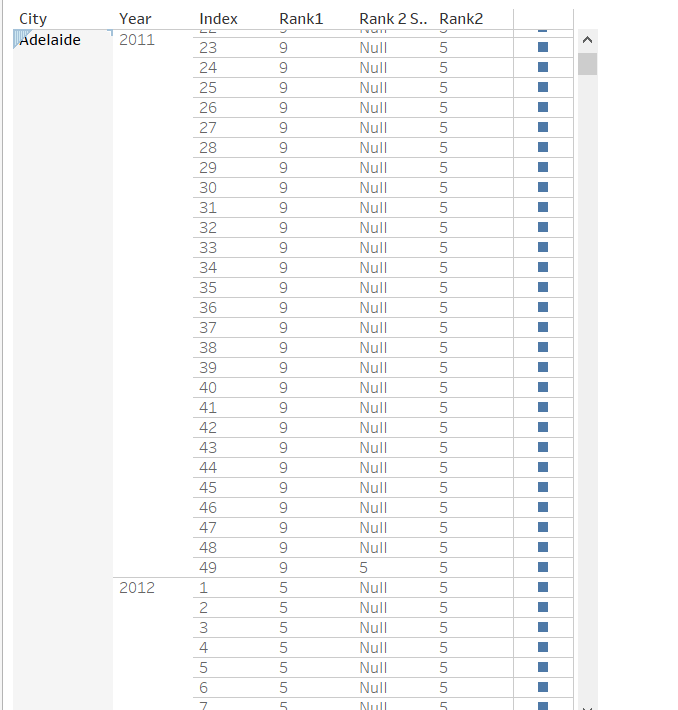
- Populate this for all the above rows by creating [Rank2]
IF(ISNULL(WINDOW_MAX([Rank 2 Setup])))
THEN [Rank1]
ELSE
WINDOW_MAX([Rank 2 Setup])
END
For [Rank2] set compute using to [Path (bin)].
- Modify [Curve] to
[Rank1]+([Rank2]-[Rank1])*[Sigmoid]
- Check each of the nested calculation and Set Compute Using as specified above.
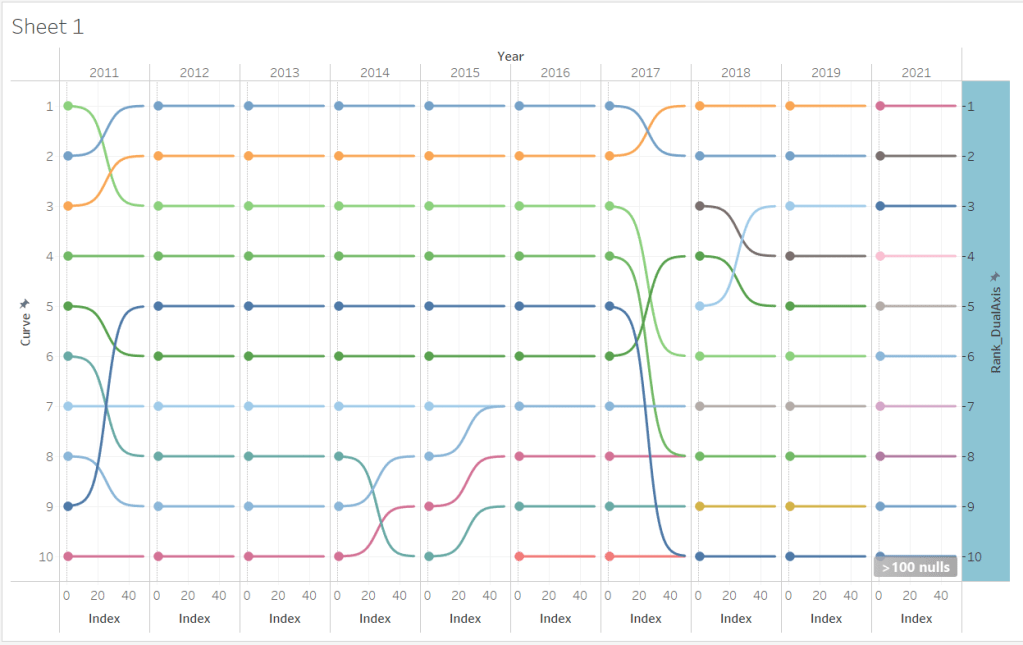
- Edit the [Curve] axis and reverse the Scale.
Now for the Circle on the chart
- Create [Rank_DualAxis]
IF [Path]=1
THEN [Rank]
END
- Drag [Rank_DualAxis] to Rows. Make it Dual axis. Synchronize the axis. Adjust the mark size.
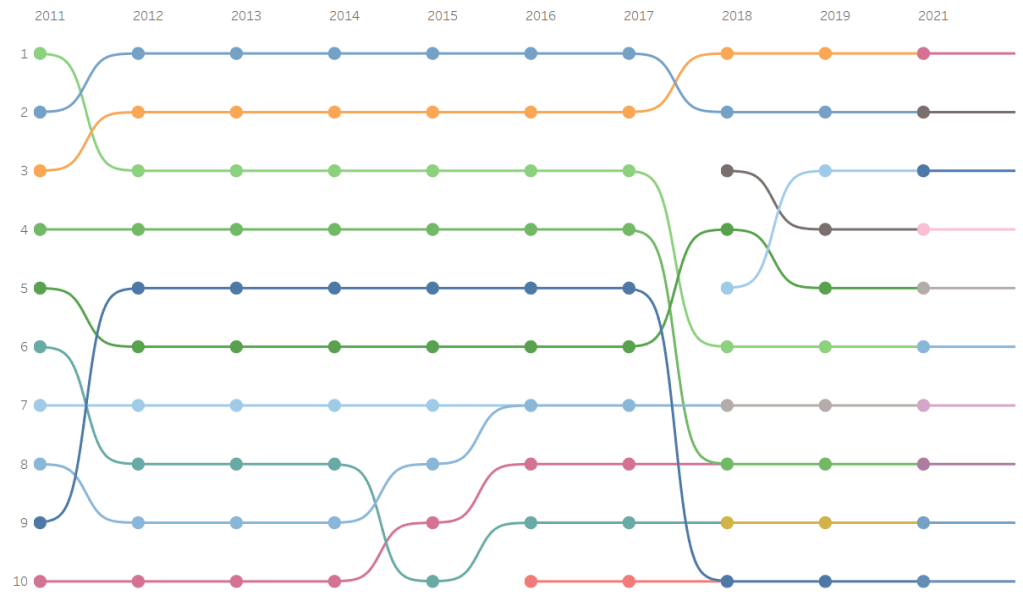
There is a gap between the line and circle. Edit the axis for [Index] to fix this.

Hide the headers and after some formatting , the final result.

Leave a comment